● PLATFORM FEATURES

Map, track and report your institution's SDG impact in one place.

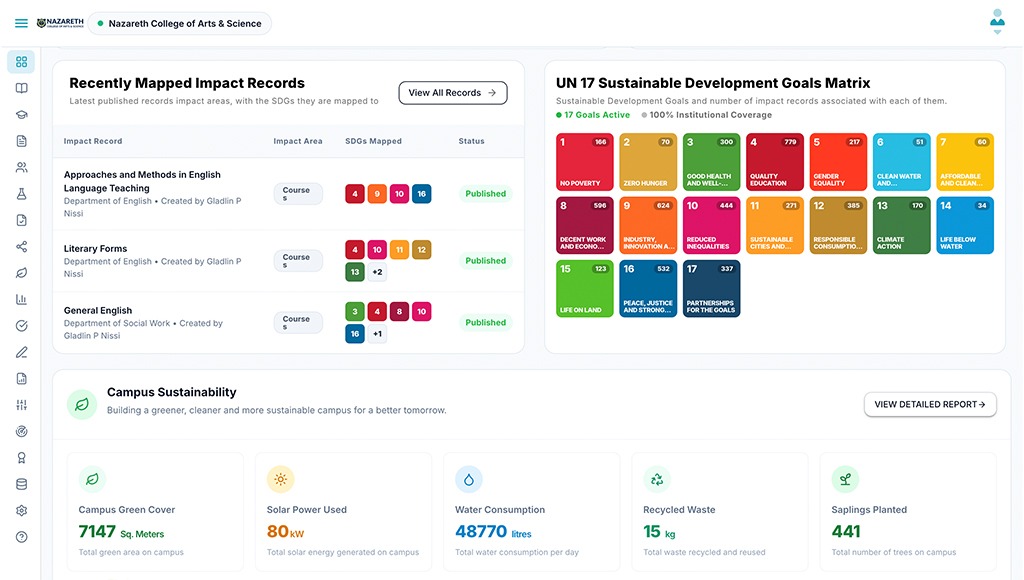
From a single course to the whole campus, MapSDG connects what you teach, research and do with the 17 Sustainable Development Goals, and turns it into evidence you can share.

ALL 8 IMPACT AREAS

A dedicated space for every kind of institutional activity.

Each area has its own record type, fields and charts, so teams capture the right detail and every entry still rolls up to the same SDG view.

Research and SDG Impact

Institutional Policies and Governance

Partnerships and Collaborations

Academic Courses / Student Projects

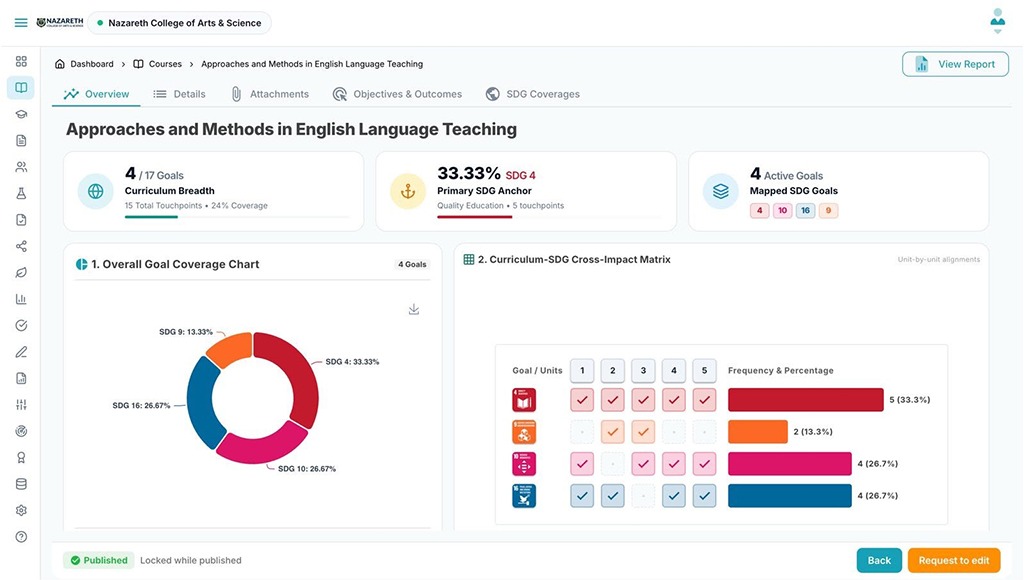
Easily map academic courses and student projects to relevant Sustainable Development Goals, helping institutions foster real-world impact through teaching and learning.

Institutional Initiatives

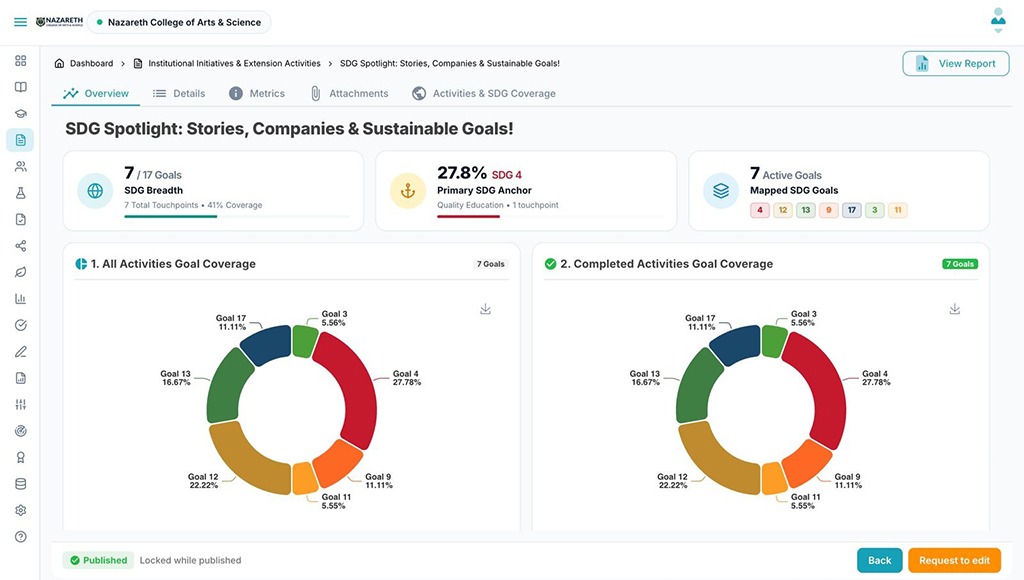
Track and showcase your institution’s SDG-aligned programs, policies, and strategic initiatives to demonstrate leadership in sustainable development.

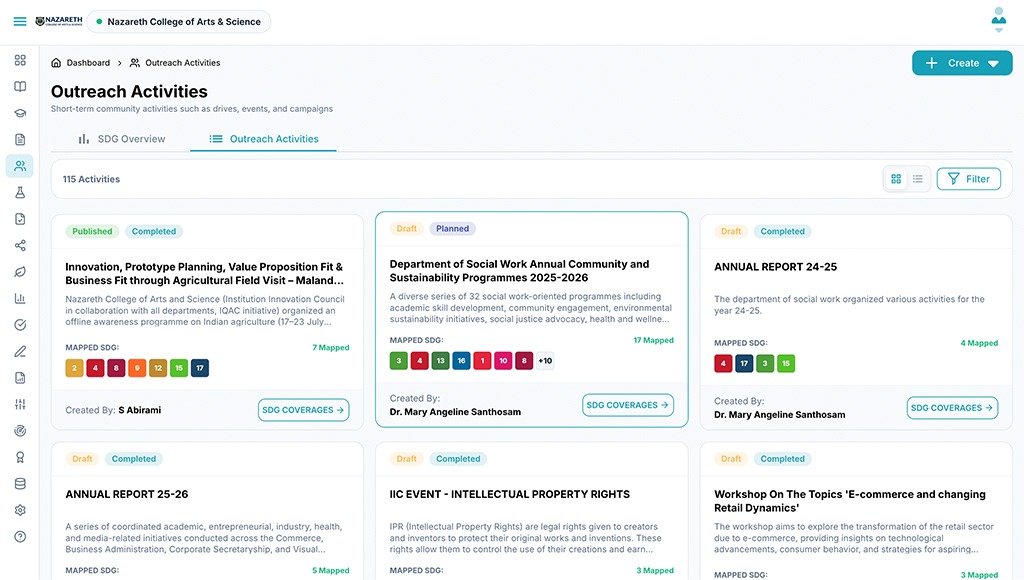
Document and align your institution’s outreach efforts with SDG targets to showcase community engagement and measurable contributions toward global goals.

Campus Sustainability

Monitor and report on eco-friendly practices across your campus—energy, water, waste, and more—to support green goals and promote environmental responsibility.

AUDITS, REPORTS AND PUBLIC PAGES

From audit to published proof, in one platform.

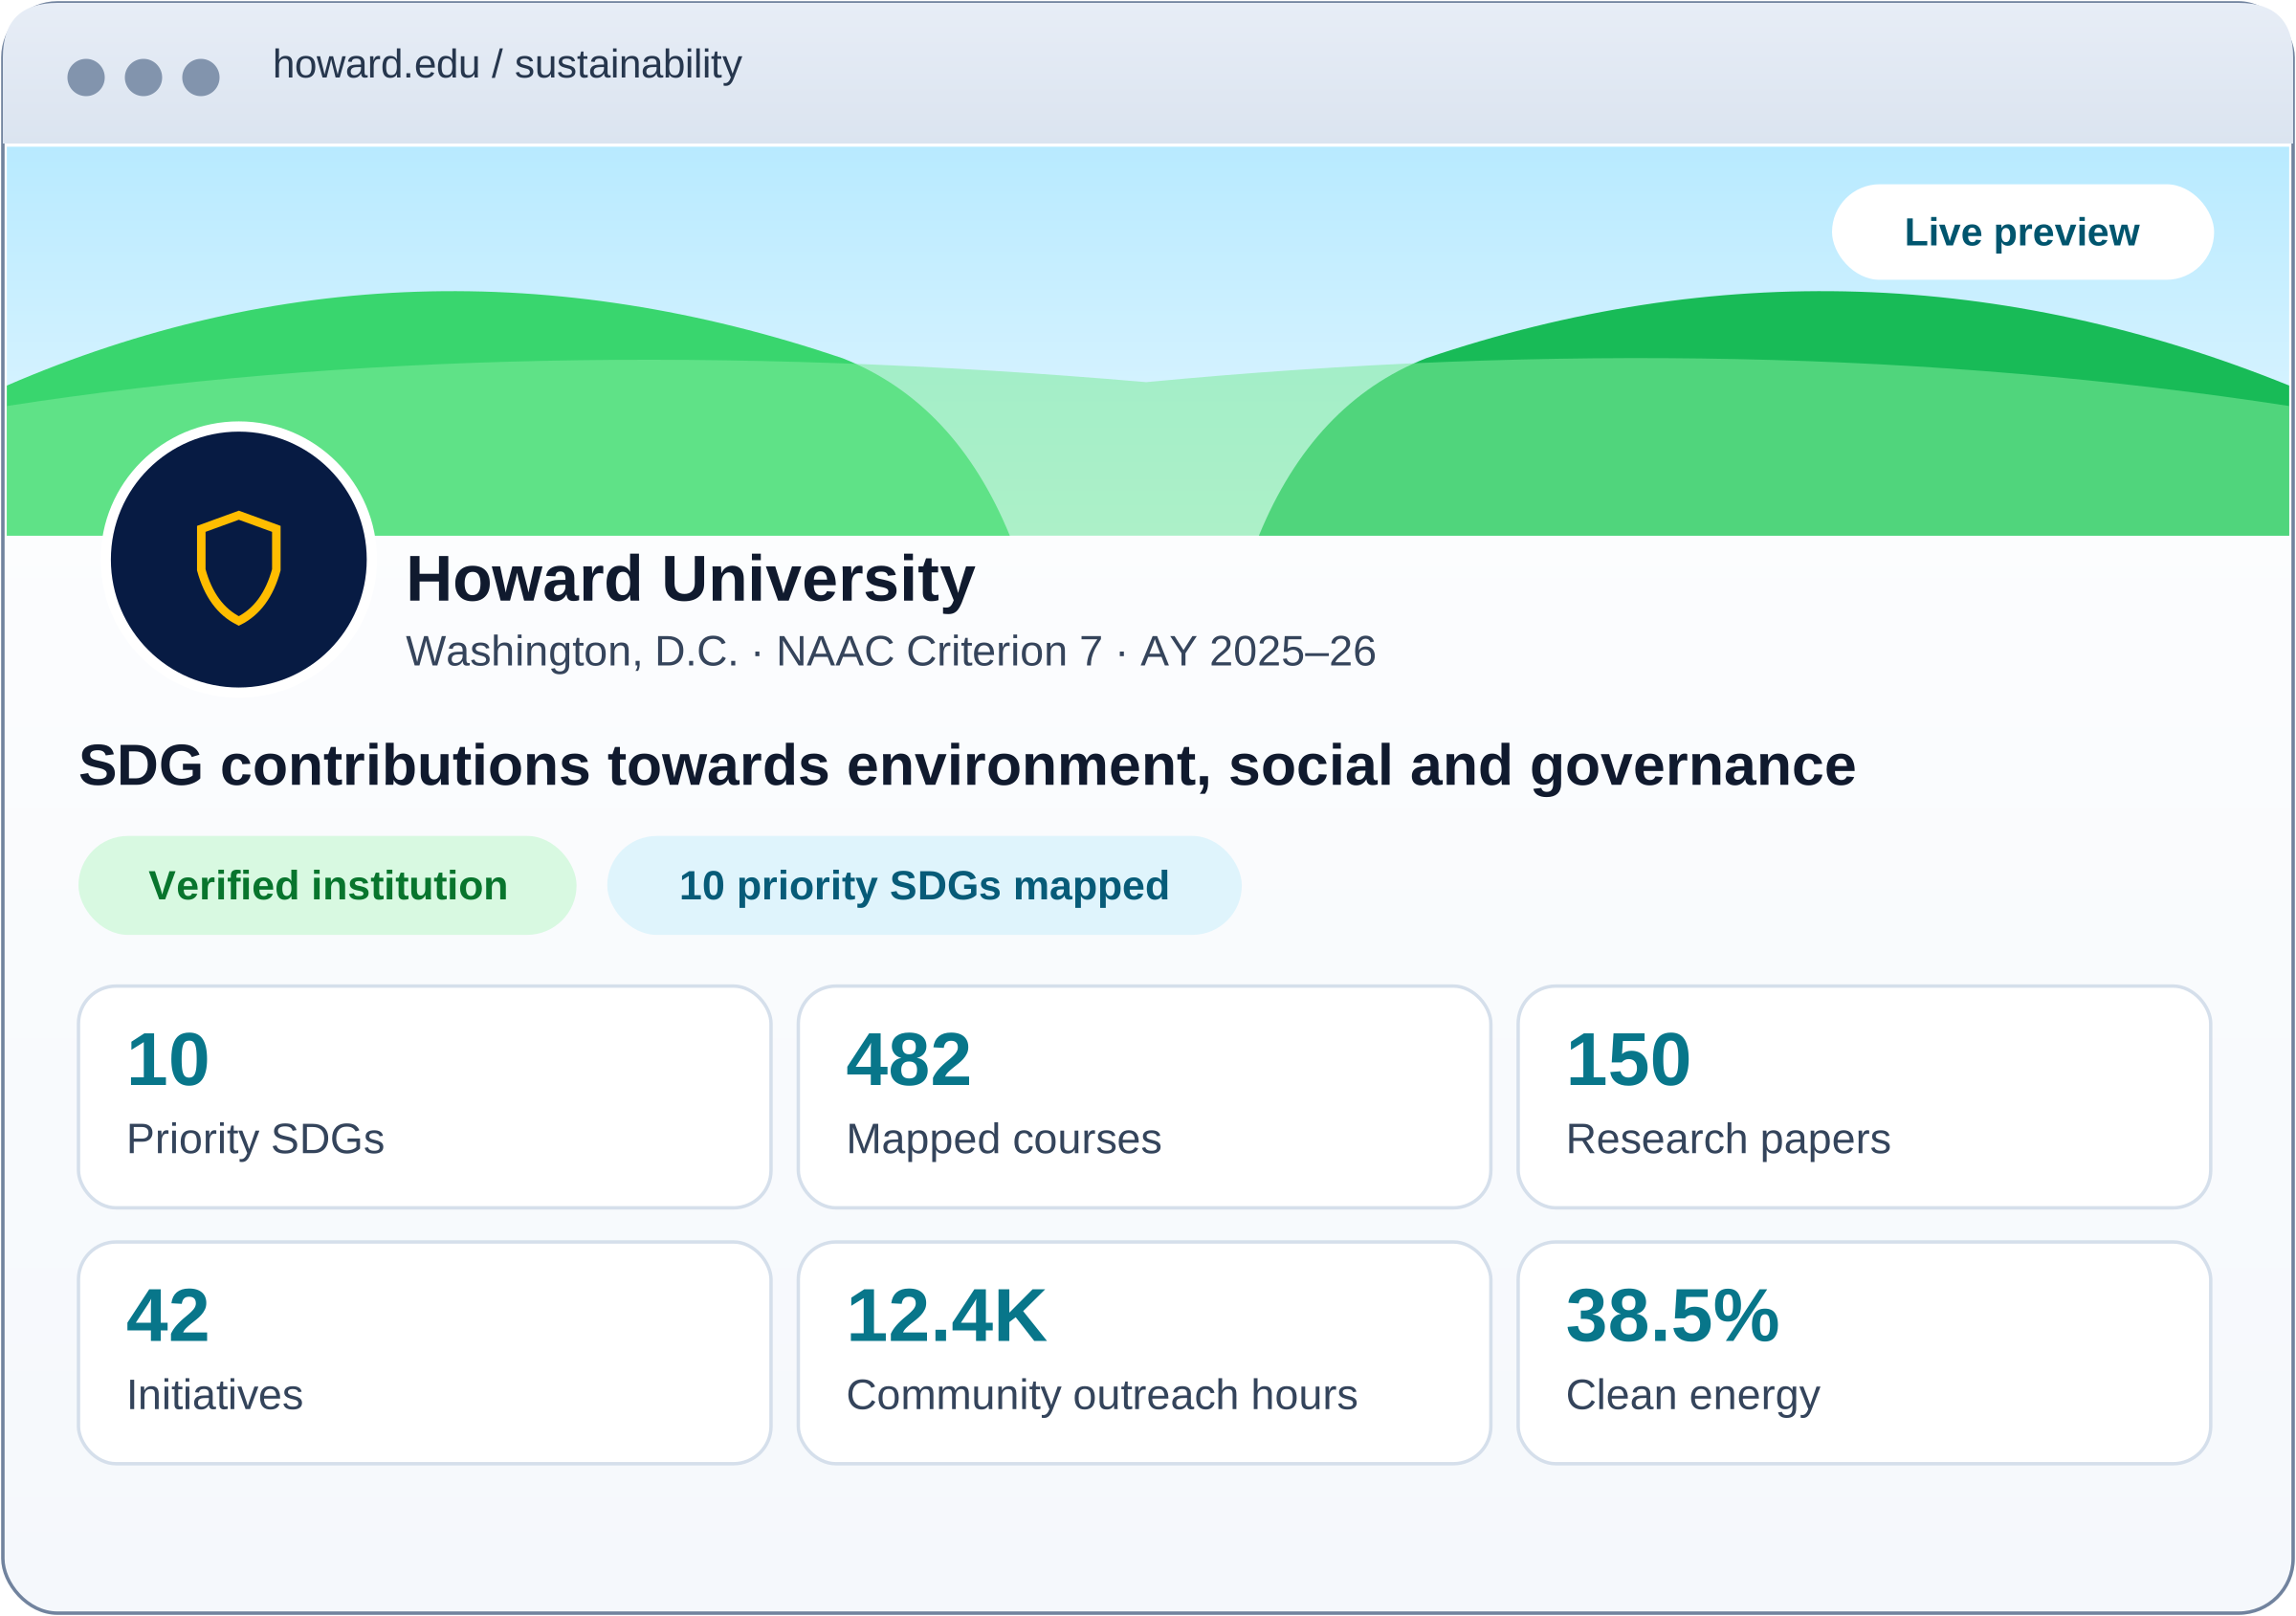
Run audits, turn your records into accreditation-ready reports, and publish
a public sustainability page, all from the same verified data.

GREEN AUDIT

Run the audit, phase by phase.

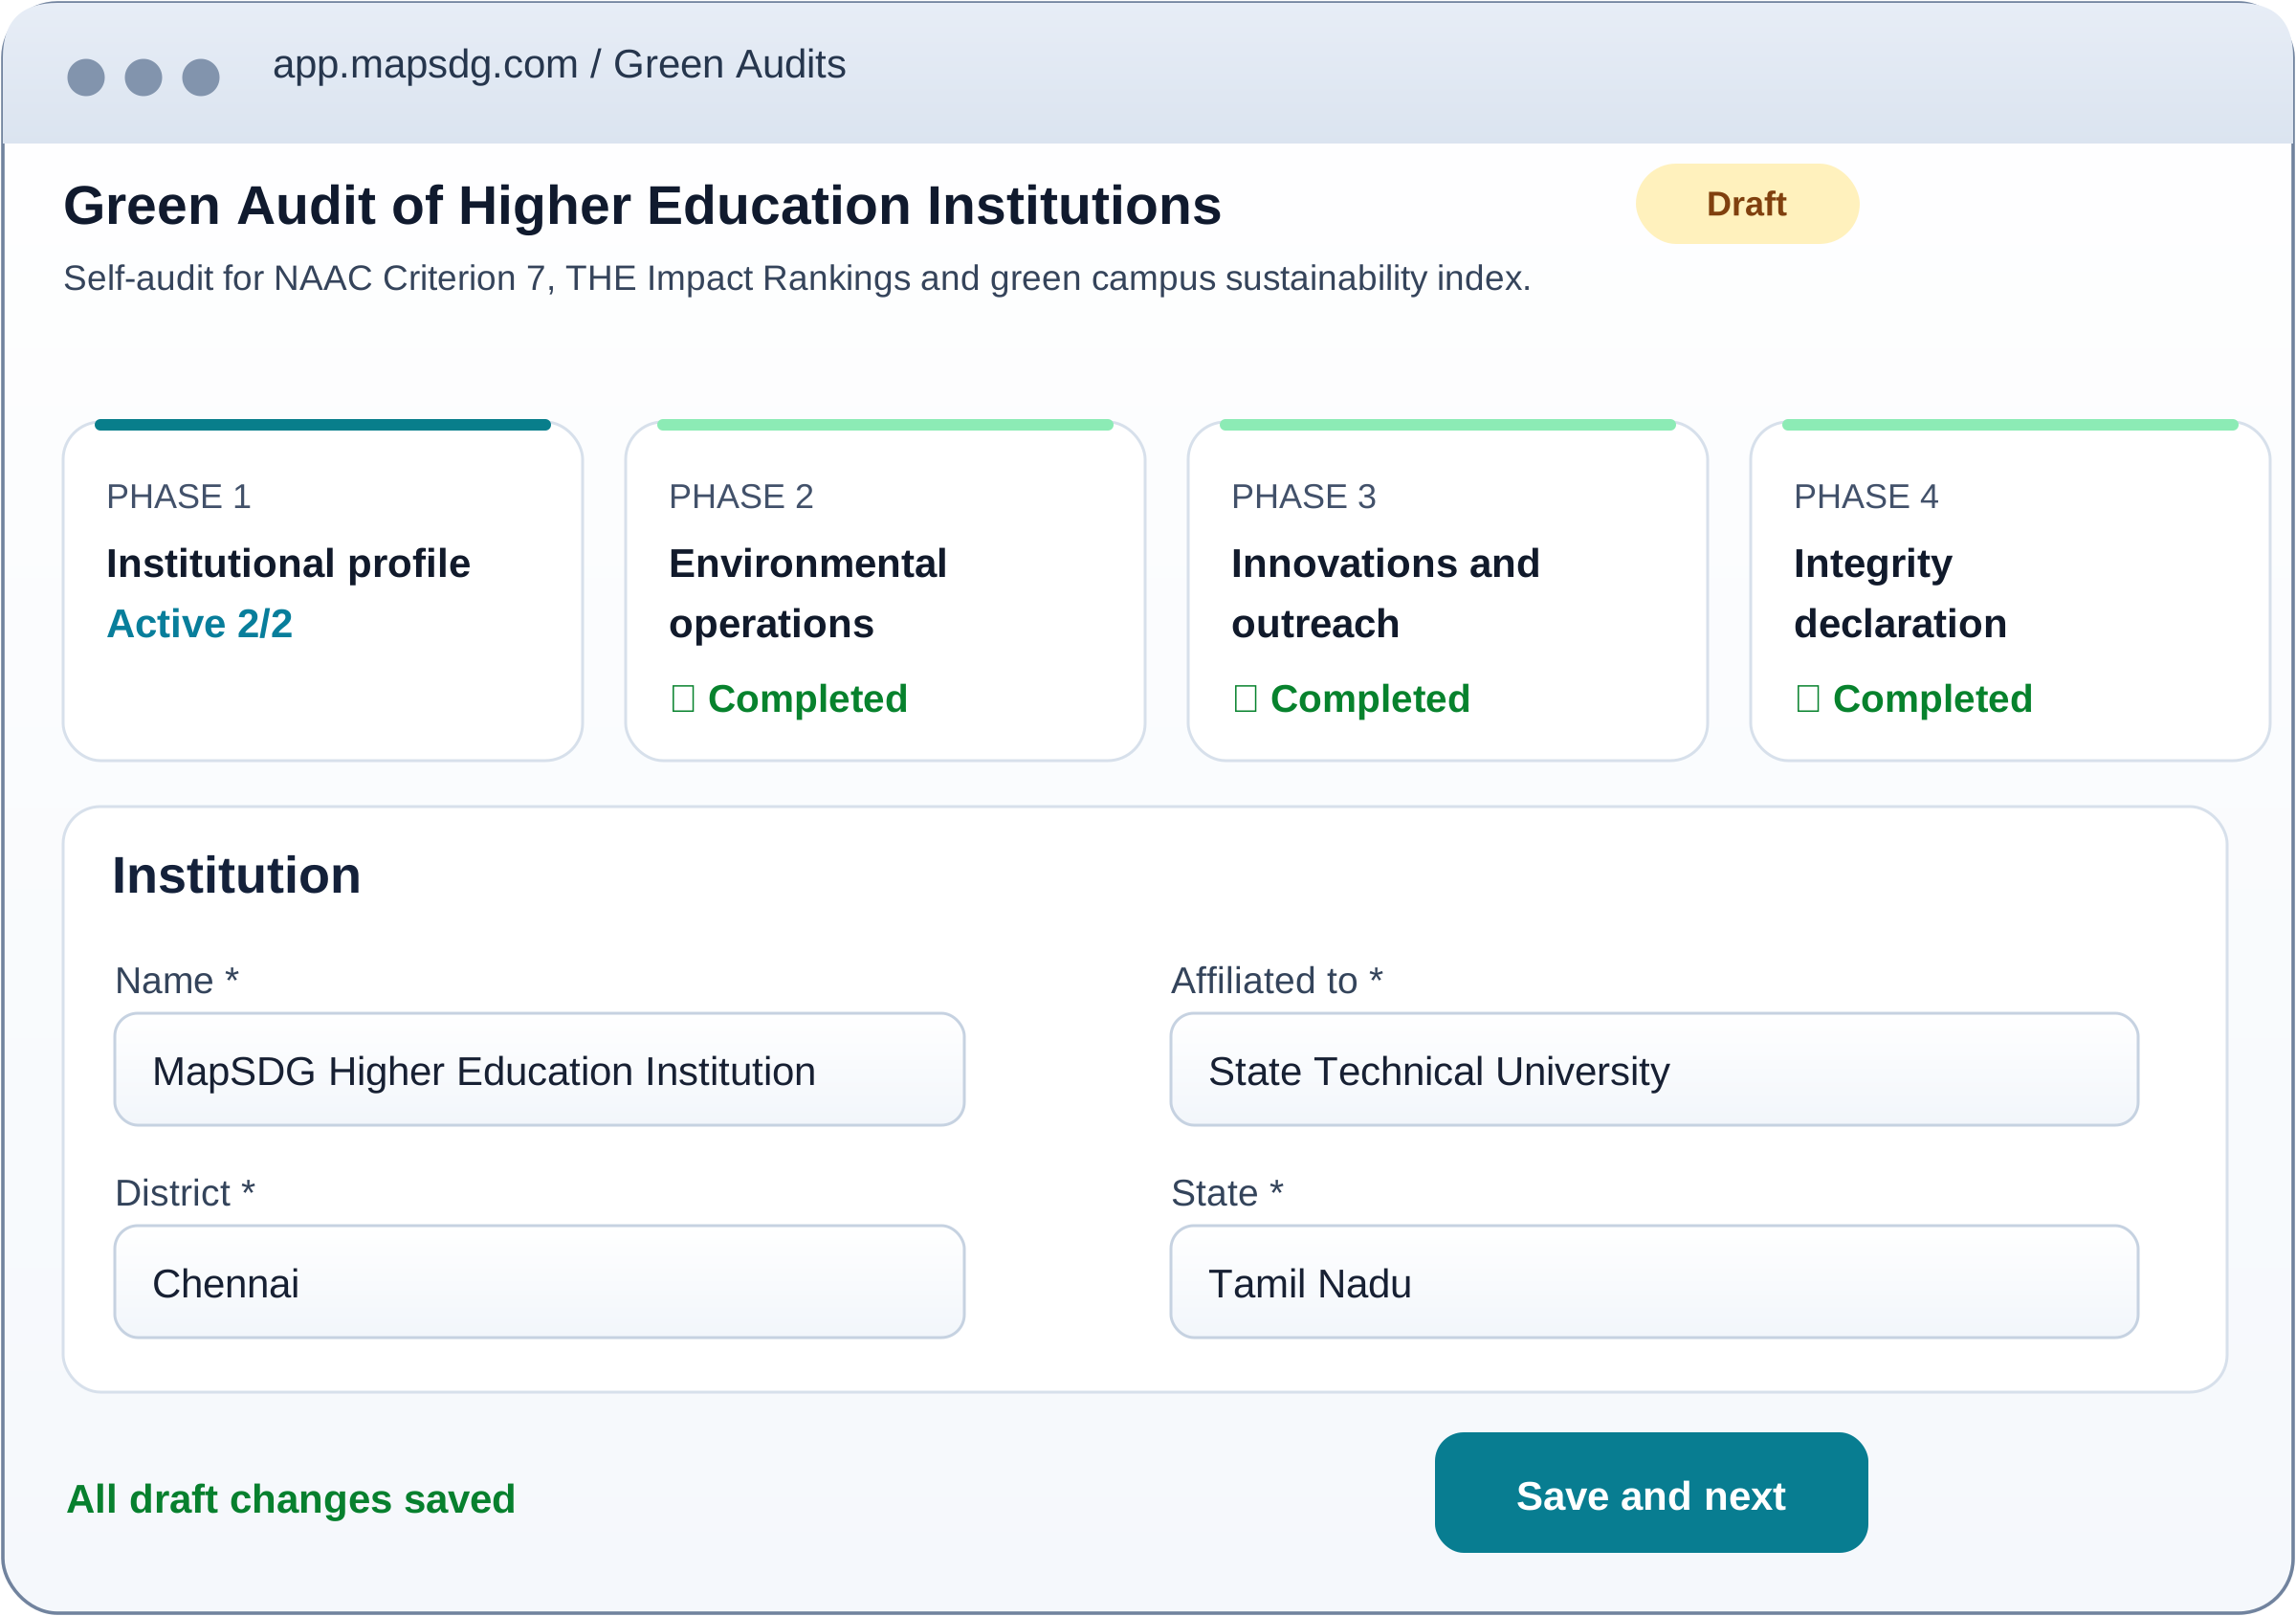
A guided four-phase green audit for campus sustainability compliance. Drafts save as you go.

SELF AUDIT

Self-assessments for faculty and staff.

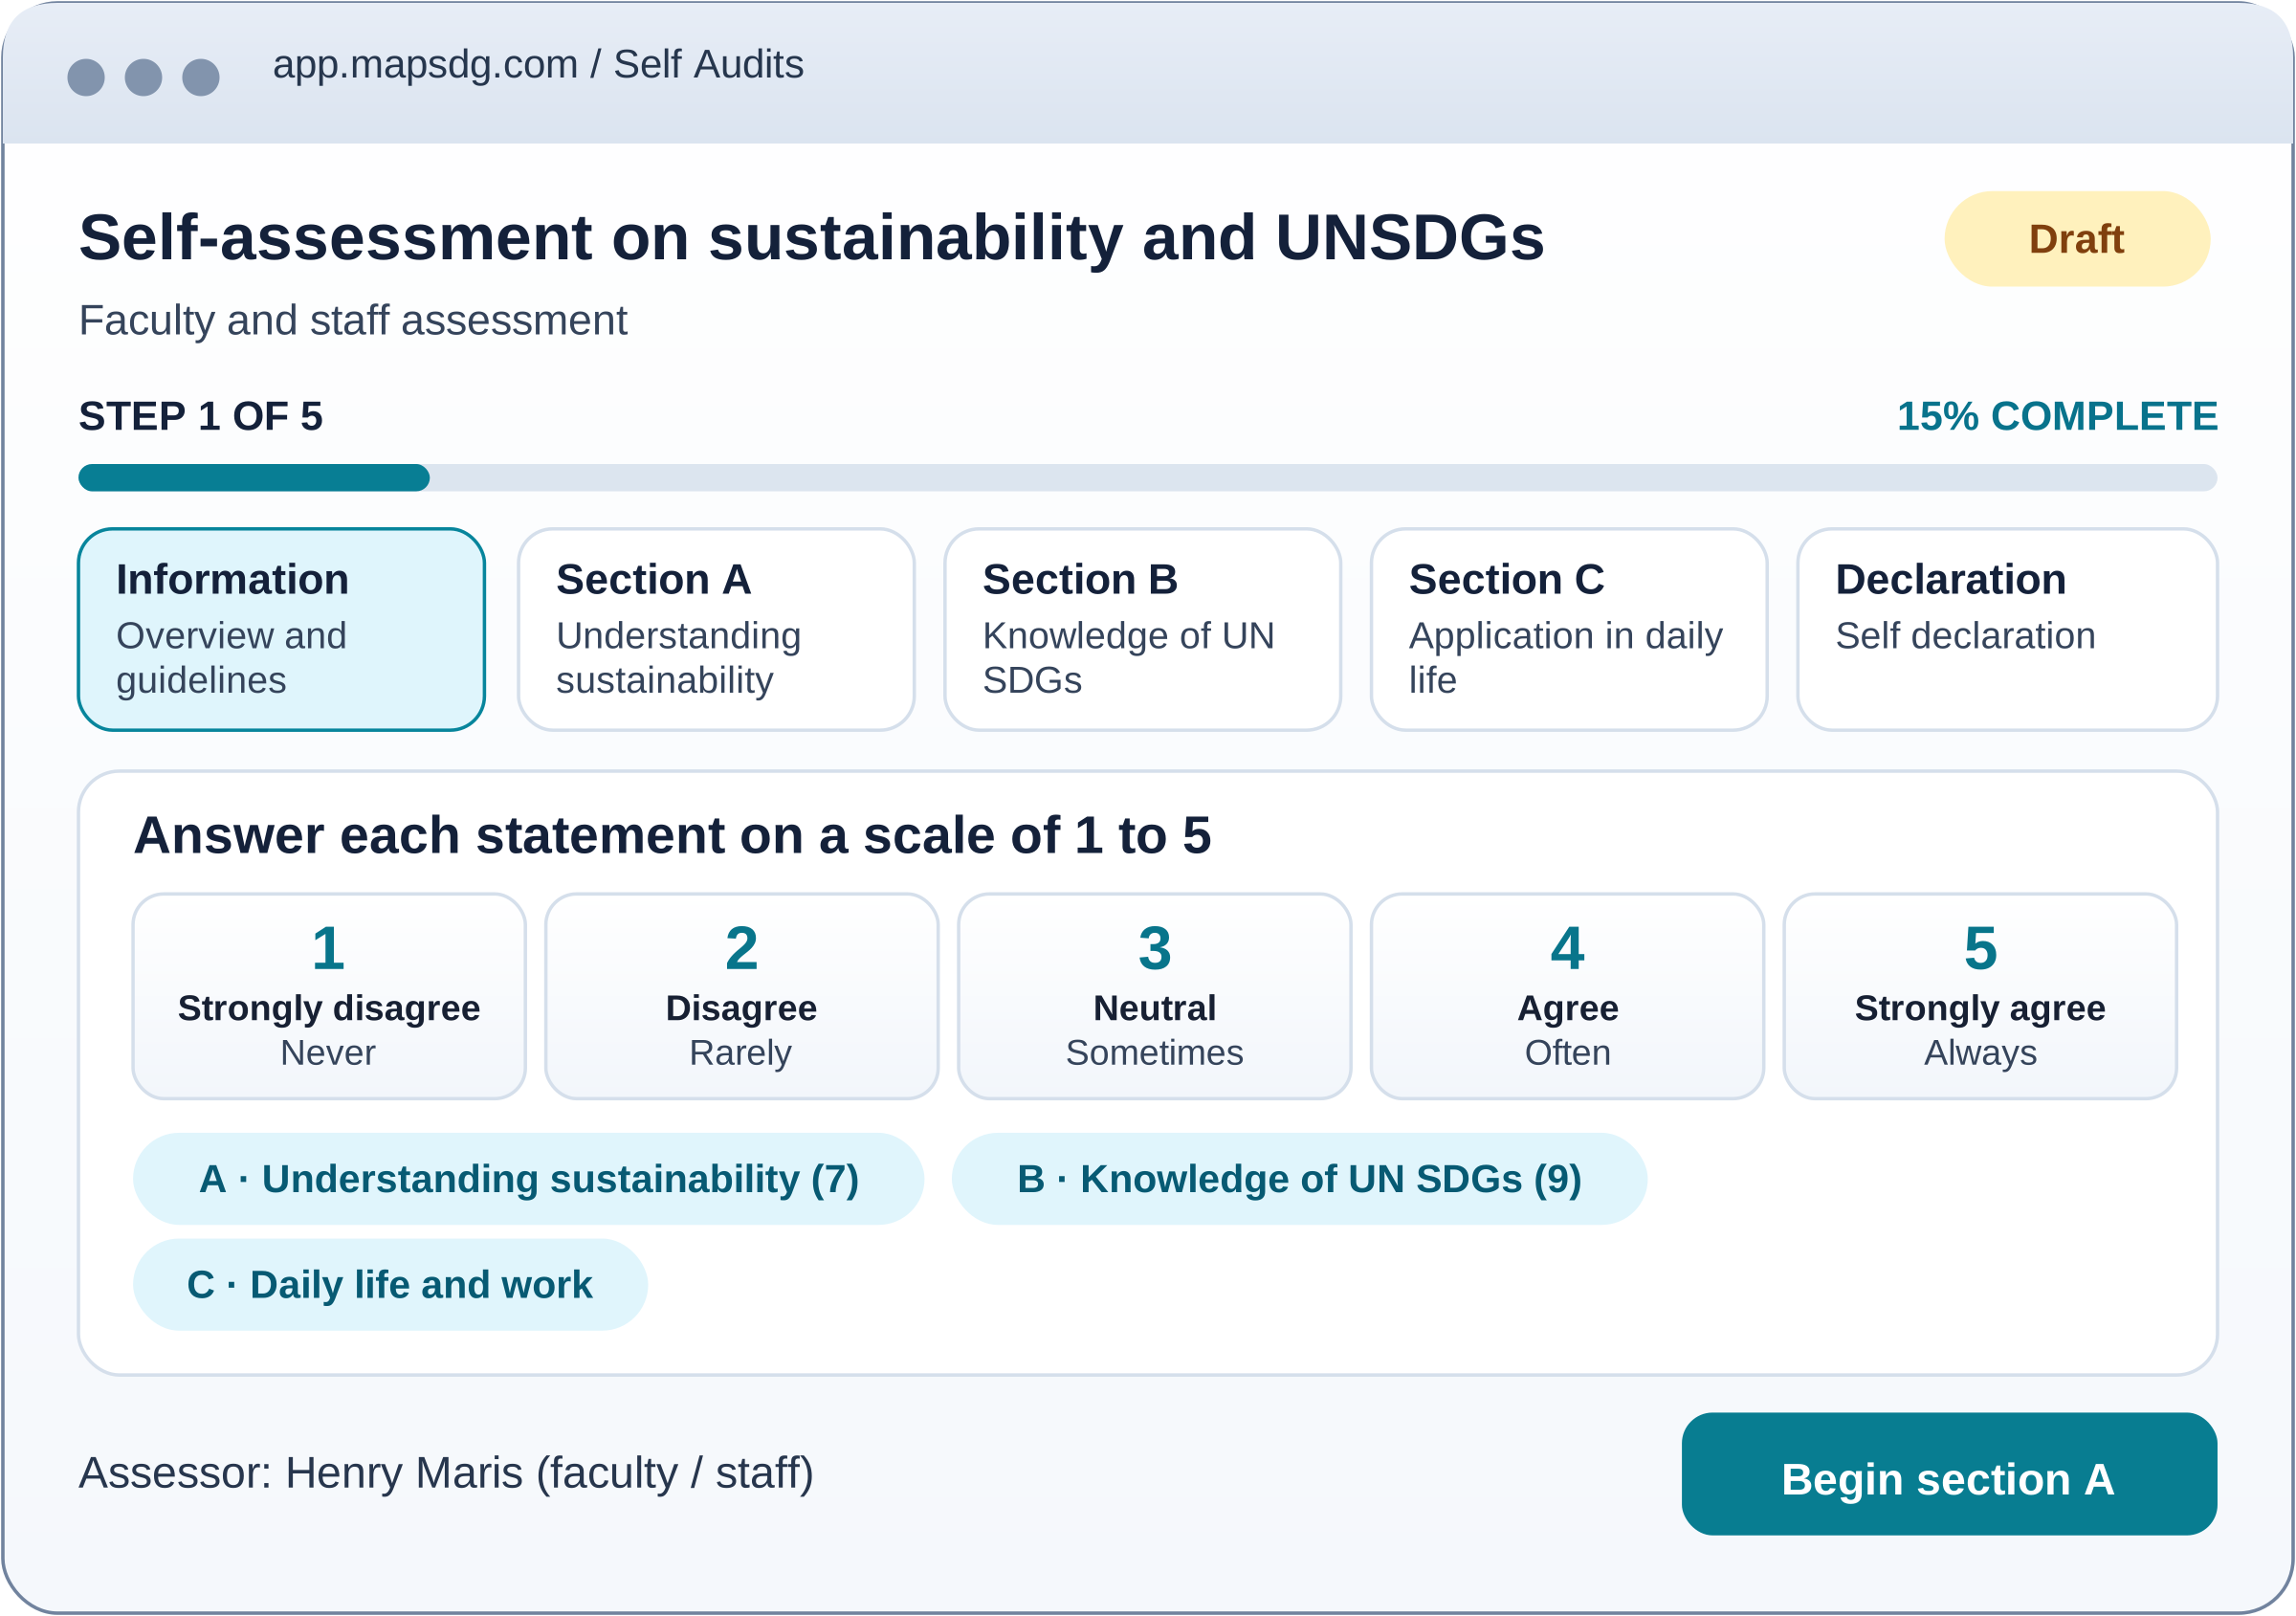
Internal audits and assessments, from sustainability awareness to greenhouse gas and water footprint reviews, with mapped SDGs.

SUSTAINABILITY REPORT

Reports built for accreditation.

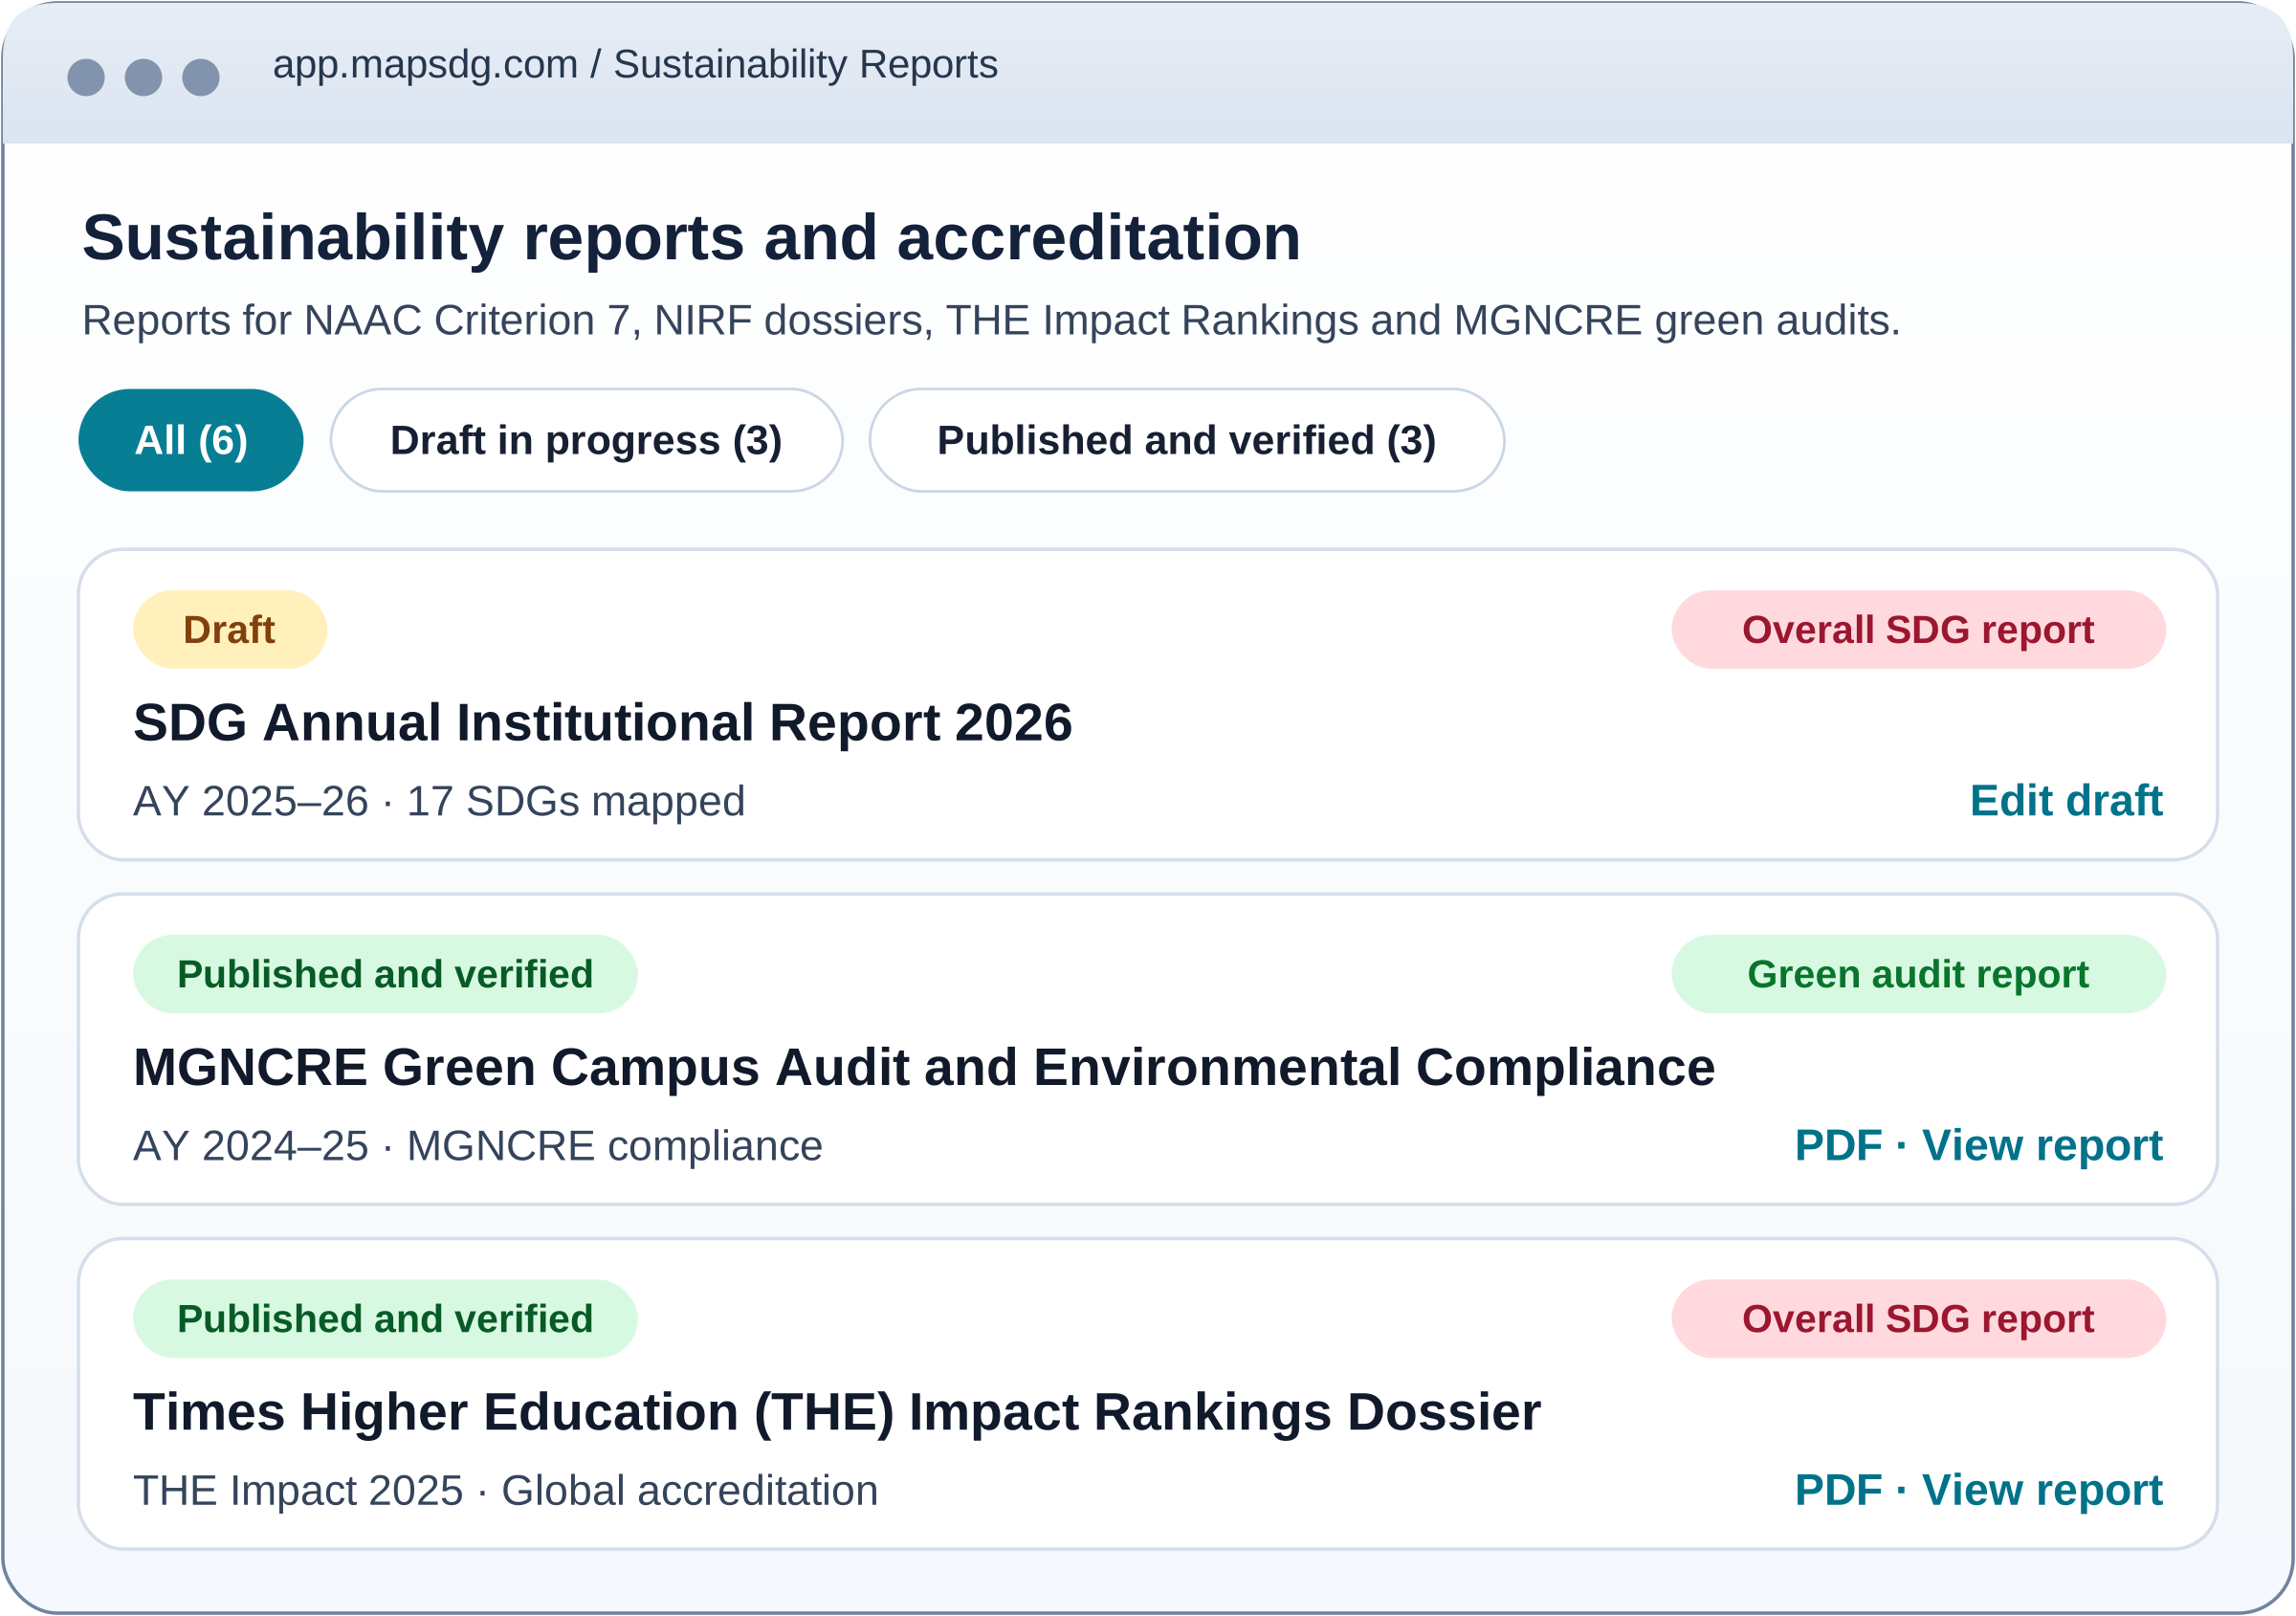
Generate institutional reports aligned with accreditation and ranking frameworks, from the data you already hold.

GREEN AUDIT

Run the audit, phase by phase.

A guided four-phase green audit for campus sustainability compliance. Drafts save as you go.

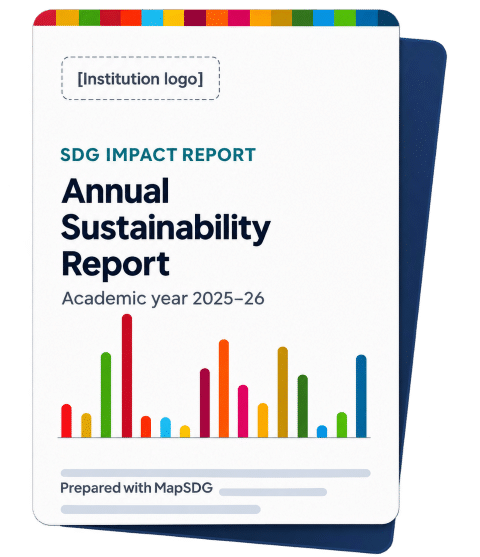
SAMPLE REPORT

See what a MapSDG report looks like.

Download a sample SDG report built with the report wizard. Browse the cover, summary, goal coverage charts and activity log before you start.

Frequently Asked Question

MapSDG is an AI-assisted platform that helps Higher Education Institutions map, track and report their contributions to the UN Sustainable Development Goals. Faculty record courses, projects, research, initiatives, outreach and campus activities as they happen, while administrators add institutional policies and partnerships, together building a continuous, evidence-backed view of the institution’s SDG impact.
SDG mapping is usually done retrospectively, through audits or bulk classification close to a reporting deadline. MapSDG makes it part of everyday institutional work. Each record is created from its source document, which is retained as evidence, so mapping becomes a continuous, participatory practice rather than a periodic compliance task.
 
Courses, Academic/Student Projects, Institutional Initiatives & Extension Activities, Outreach Activities, Research & SDG Impact, Institutional Policies & Governance, Partnerships, and Campus Activities. Together they cover teaching, research, community engagement, governance and campus sustainability.
 
It happens in one simple, guided workflow. Users upload a document such as a course syllabus, project report or activity report (research can also be added through its DOI). MapSDG reads the content, fills in the record details, and suggests the relevant SDGs with weightages and the reasoning behind each mapping. Users review the result before saving and can re-analyse with an updated document. Syllabi with units are mapped unit by unit, and a single document covering several activities is split into separate activities, each with its own mapping.
 
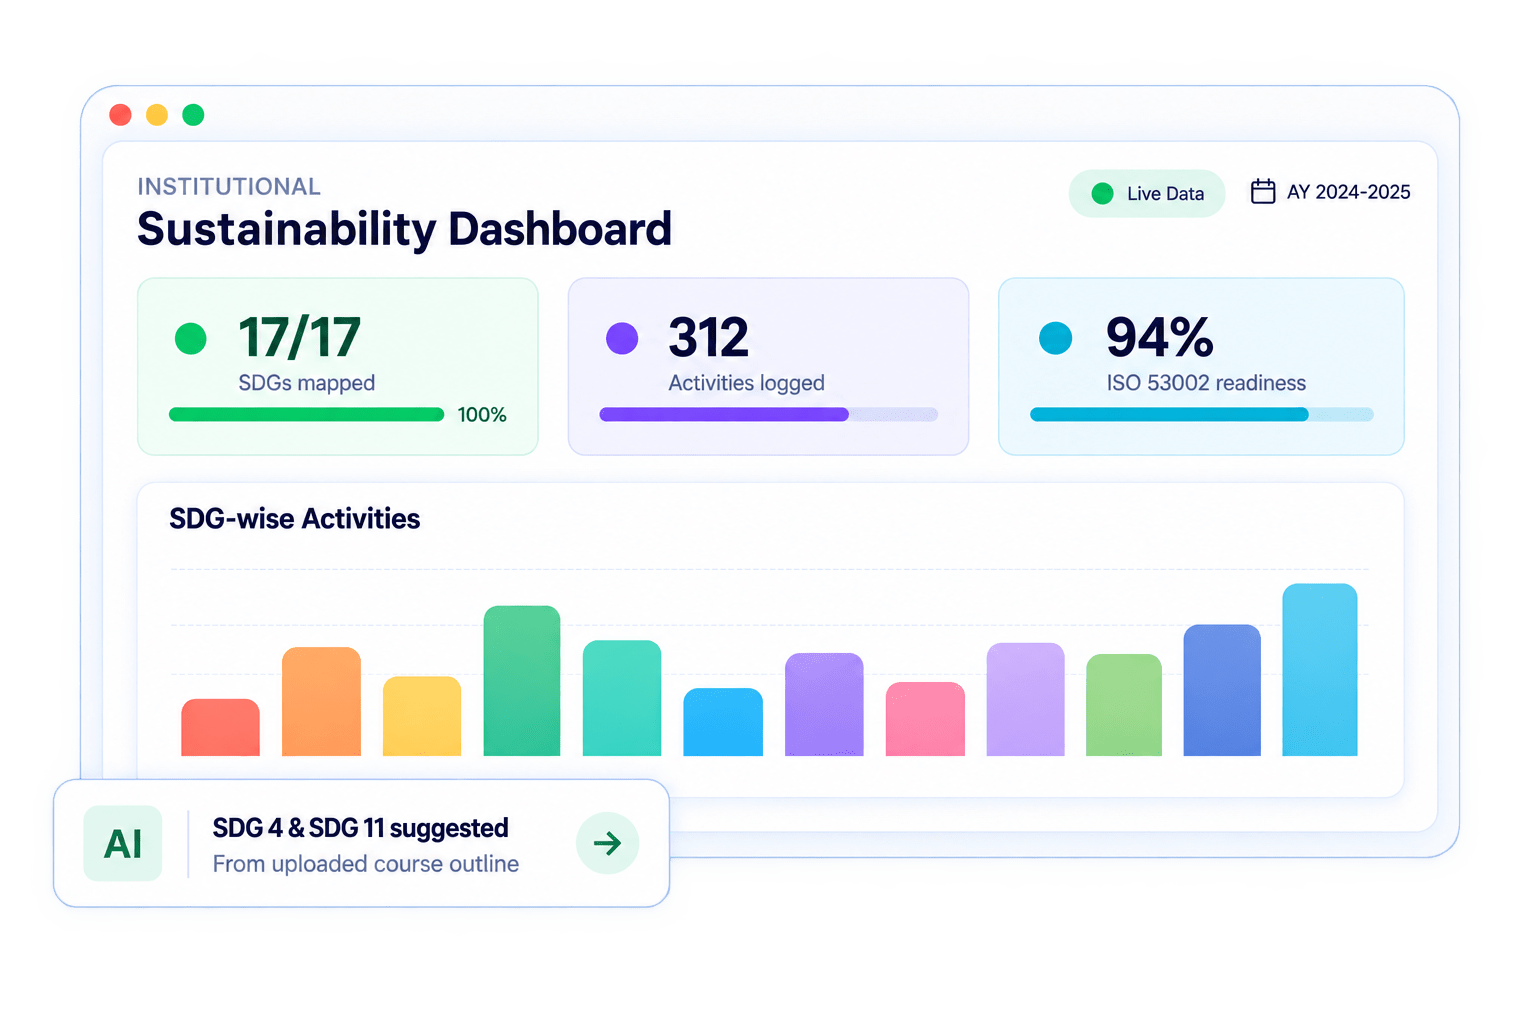
The institutional dashboard shows SDG contributions from three views: overall performance, impact area, and goal wise. It highlights the leading goals and those needing attention, shows where each impact area contributes through a coverage heatmap, and lets users drill down from any goal or chart into the underlying records.
 
MapSDG generates Overall SDG, Impact Area, Record Level and Green Audit reports through a guided report builder. The overall report is organized goal by goal, with the option to choose which goals to include. Reports can be filtered by department and carry institutional branding, cover images, and introductory sections such as a foreword and executive summary.
 
Yes, as the source of evidence rather than the final submission. Since activities are recorded with their supporting documents throughout the year, institutions have organized, SDG-mapped evidence ready when preparing for accreditation, rankings or sustainability reporting. MapSDG reports are not formatted to any specific framework. Institutions draw the relevant evidence and reports from MapSDG and prepare the final submission in each body’s prescribed format outside the platform.
 
Institutions can request a product demonstration to see the platform and discuss their requirements, or sign up for the 15-day free trial to explore it first-hand.

Download Sample Report

Book a Demo

Book a Orientation