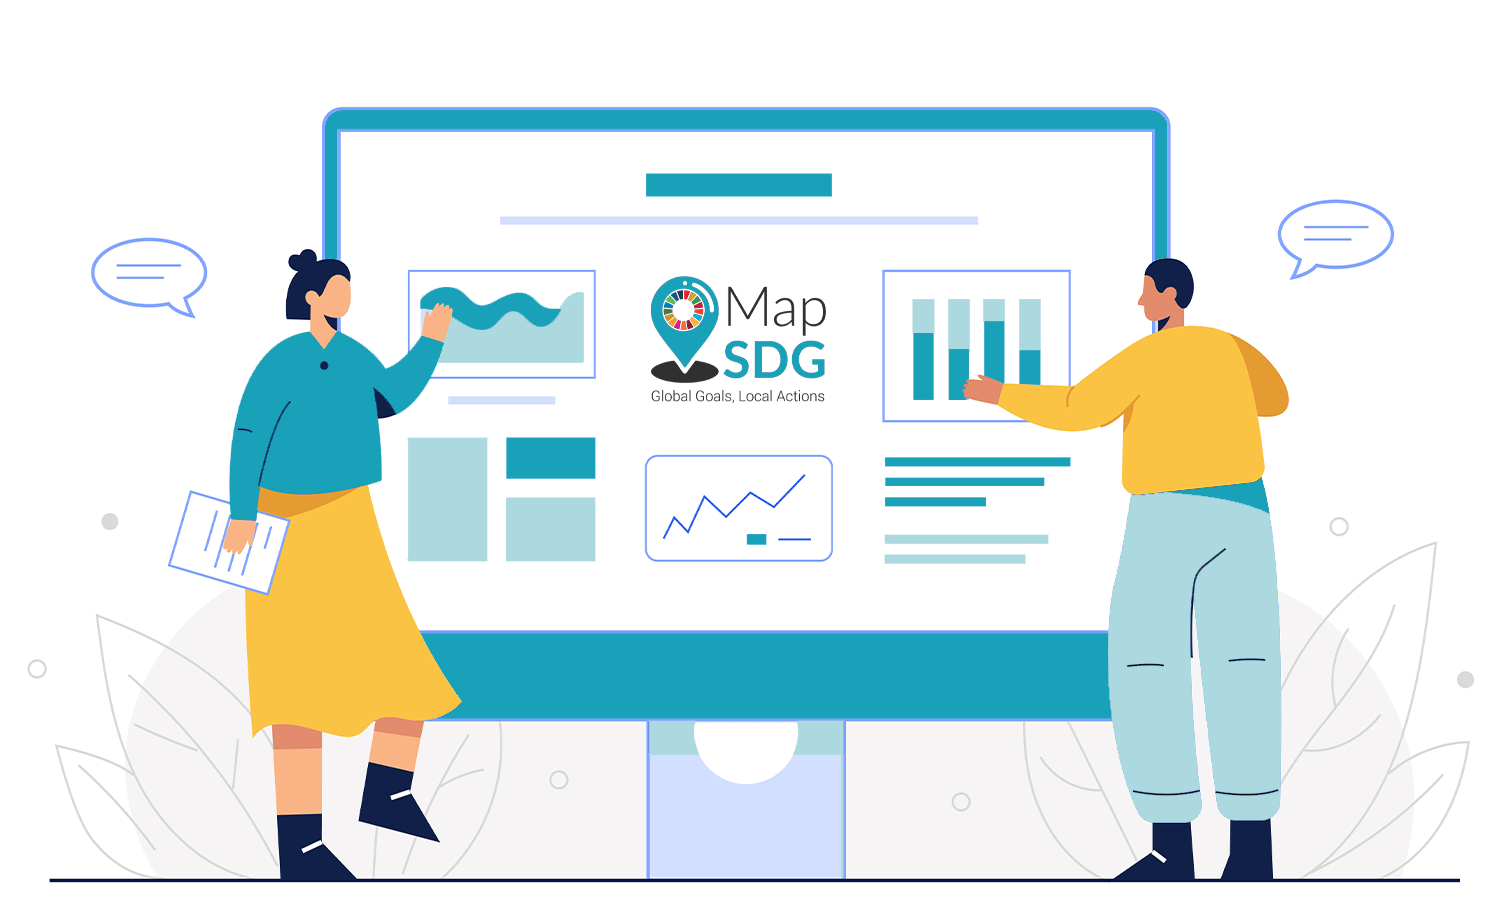
In the evolving landscape of higher education, Sustainable Development Goals (SDGs) are no longer just a global framework—they’ve become a benchmark for academic institutions to measure relevance, responsibility, and results. Traditionally, Higher Education Institutions (HEIs) have relied on annual reports, fragmented documentation, and siloed data to showcase their SDG contributions. But today, there’s a smarter way forward: real-time SDG tracking through interactive dashboards.
The Shift from Static Reports to Real-Time Tracking
Static reports, often prepared at the end of the academic year, offer a snapshot of institutional initiatives. However, these reports:
- Are reactive rather than proactive
- Lack timely feedback for decision-makers
- Require extensive manual effort to compile
In contrast, a real-time SDG dashboard for colleges provides a dynamic, continuously updated view of institutional progress across all 17 SDGs. Dashboards bring transparency, accelerate institutional learning, and highlight gaps before they widen.
Why Real-Time SDG Dashboards Matter for HEIs
Real-time dashboards align seamlessly with accreditation demands and stakeholder expectations. Here’s how they contribute:
1. NAAC and NIRF Readiness
- Map institutional activities directly to SDG indicators linked with NAAC criteria (like Curriculum Enrichment, Student Support, Institutional Values, and Best Practices).
- Visualize outcomes and community engagement impact—boosting performance in NIRF’s outreach and inclusivity categories.
2. Institutional Impact Metrics Made Measurable
- Track key metrics like gender parity in admissions (SDG 5), renewable energy usage on campus (SDG 7), and carbon footprint reduction (SDG 13).
- Use analytics to compare departmental contributions, track longitudinal progress, and justify funding proposals.
3. Improved Stakeholder Communication
- Share interactive dashboards with internal and external stakeholders, including faculty, students, governing bodies, and accreditation panels.
- Present clear visual stories of how your institution drives sustainability.
Case Examples: From Reporting to Impact
- GreenVision University implemented a real-time SDG dashboard to track its energy usage, water conservation, and outreach programs. The platform helped the institution cut manual reporting hours by 60% and showcased impact live during their NAAC visit.
- Sri Amrita College of Arts and Science used an SDG dashboard to integrate student projects with SDGs and gamify participation. The result? Over 300 student-led SDG activities in a single academic year—all traceable and reportable.
- A Technical University in South India tied research outcomes to SDG categories using MapSDG’s platform, ensuring transparent grant reporting and enhanced global rankings.
How MapSDG Powers Real-Time Impact
MapSDG enables HEIs to:
- Collect data across academic, administrative, and student domains
- Auto-map activities and KPIs to SDG targets
- Display department-wise contributions in customizable dashboards
- Export ready-to-use reports for NAAC, NIRF, ARIIA, and internal review
Conclusion
In an era where sustainability defines institutional leadership, real-time SDG dashboards are no longer a luxury—they are a necessity. HEIs must move from documentation to data-driven action. With tools like MapSDG, colleges can stop simply reporting impact—and start amplifying it. To get started with a plan that fits your institution, visit our pricing page.
Ready to transform how your institution measures sustainability? Explore MapSDG’s real-time dashboard solutions or schedule a demo today.


